When you hear the product “Claude Code”, it’s easy to assume that it’s only for developers and coding.
But that would be missing out on so much of what Claude code can do for strategy, ideation, planning, tracking, and so much more.
And it produces reports, works faster, and accomplishes tasks at a higher quality, and often faster, than other AI tools on the market. For example, every month, I get an automatic report that tells me every feature our developers released and the impact it had on our KPIs:

I use AI products all day, every day, and Claude Code has become my go-to AI tool. And 90%+ of the time I’m using Claude Code, it’s not for coding.
Today, I’m going to share three ways I actively use Claude Code as a 0-to-1 General Manager and Product leader.
You’ll learn how Claude Code can help you automate reports, track KPI results related to feature updates, understand your team’s output (without the B.S.), better organize customer feedback, and lots more.
Claude Code is insanely powerful, but can getting started can seem overwhelming.
The simplest way to start using Claude Code is through an IDE (Integrated Development Environment), which is an app for your computer that can run Claude Code.
The best IDEs to start are Cursor (the best way to start), Windsurf, or Warp. I personally use Warp because I like the interface, but any of the IDEs recommended have generous free plans that you can use with Claude Code.
If Cursor or Windsurf is the easiest to get started. You can simply run the claude command to install Claude Code. Once you run the claude command, the install will auto-start. If you run into any issues, check out the Claude Code install guide.
When setting up Claude Code, you’ll need to have a paid Claude account. You can use the API (not suggested, as costs can add up quickly) or simply a Claude paid plan, which is the same plan you’d use on Claude.ai (recommended). I recommend starting with the $20 per month “Pro” plan.
If you have any trouble installing Claude Code, ask Claude.ai to help you. For example, here are some prompts that you can use:
- “I am trying to install Claude Code on my MacBook. I have Cursor installed but I’m not sure what to do next. Attached is the screenshot of my Cursor [paste screenshot]. Can you help me?”
- “I am getting an error when trying to install Claude Code in Windsurf on my Windows PC. Can you help me install Claude Code?”
- “How do I install Claude Code in my IDE? I use Warp. Please give me detailed step-by-step instructions. I’m a founder, but I’m not technical so I need you to make the steps basic for me to understand.”
Once you have Claude Code installed, here are three ways I use it every week for you to copy.
Strategy #1 – Weekly/Monthly Developer Analysis
Part of my responsibility as Founding General Manager & Head of Product for our 1M+ user, nine-product business is to make sure we’re focusing the right team members in the right places on the right tasks.
And iur goal is to move FAST.
Fast 0-to-1 MVPs, fast iterations, fast product-market fit (MVPs). All at the fastest pace possible.
Every month, I use frontier AI models (like Claude 3.7 Sonnet and 4.1 Opus, ChatGPT 5-Thinking, and Gemini 2.5 Pro with Deep Thinking) to help ideate and plan our product features for TidyCal, BreezeDoc, and others.
The end output is a product plan document that focuses on speed of MVP launches for new ideas and products, and iterating existing features to gain traction. Here’s part of what a product plan looks like:

The speed of execution is a big reason why 33% of our products have generated >$1M in revenue, compared to the industry standard of ~4%.
Once the document is ready, I work with our Product team of designers and developers to start taking fast action. And I use Claude Code to help track our speed of execution and analyze our developers.
Every Monday, I get a report that tells me what our developers did the past week and if it was up to industry standards. This helps me understand if our developers are focusing on the right areas and moving at the speed we expect.
Here’s an example of this report:
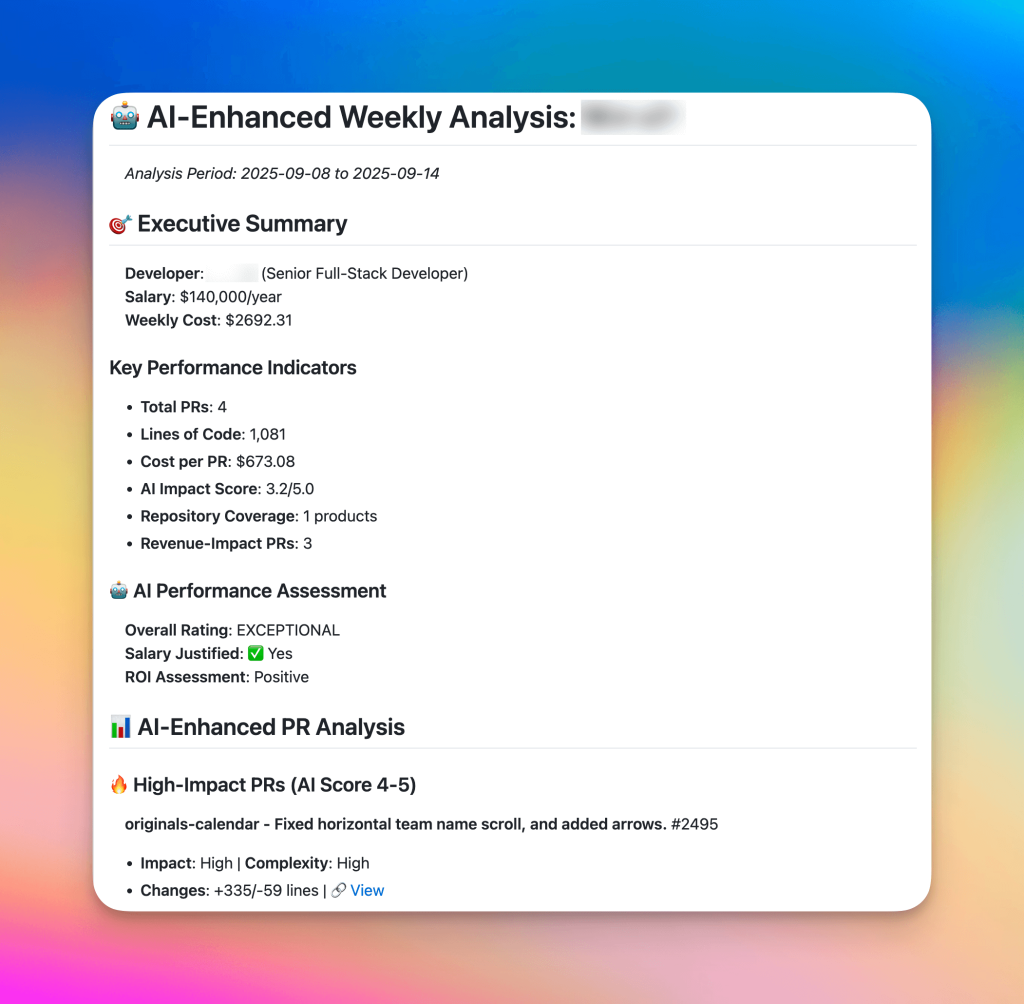
And at the beginning of a new month, I also get a monthly report of the previous month. This gives more context for the impact of our dev team — the ebb-and-flow of weeks can sometimes have holidays, vacations, or tasks that take longer that expected.
When I get the report on Monday morning, it’s about two hours before our weekly Product team meeting. So I can use the report to quickly re-focus our priorities and actions. It’s all about speed.
Here’s a prompt you can use with Claude Code to start building your own weekly developer analysis:
  # Developer Performance Analysis Prompt

  Create a comprehensive weekly developer analysis system that evaluates team members' GitHub contributions with business impact focus. The system should:

  ## Core Requirements

  ### 1. Data Collection
  - Fetch PRs from specified repositories for a date range (previous week)
  - Support multiple developers with configurable salary/role information
  - Analyze PR metadata: lines changed, title, description, files modified

  ### 2. Business Impact Scoring
  Create an AI-powered scoring system (1-5 scale) that evaluates:
  - **Technical Complexity**: Based on lines changed, file types, architectural impact
  - **Business Value**: Keywords indicating revenue impact, customer features, integrations
  - **Strategic Alignment**: Cross-platform work, innovation, technical debt reduction

  ### 3. Performance Metrics
  Calculate and track:
  - Total PRs per week with cost-per-PR analysis
  - High/medium/low impact ratio (target: 30%+ high-impact)
  - Repository diversity (cross-platform expertise)
  - Revenue-focused work percentage
  - ROI assessment based on salary vs. business impact

  ### 4. AI-Enhanced Assessment
  Generate insights on:
  - Technical leadership indicators
  - Areas for improvement with specific recommendations
  - Salary justification analysis
  - Strategic development path suggestions
  - Pattern recognition across work types

  ### 5. Report Structure
  Create professional reports with:
  - Executive summary with key metrics
  - Categorized PR analysis (high/medium/low impact)
  - Strategic technical assessment
  - ROI analysis with salary performance metrics
  - Actionable recommendations for next 2 weeks and 3-6 months
  - Repository performance breakdown

  ## Key Innovation: Business-Aligned Analysis
  Unlike typical code metrics, focus on business impact by:
  - Prioritizing customer-facing features over internal refactoring
  - Measuring revenue-generating work vs. maintenance
  - Assessing cross-platform expertise and team multiplication
  - Evaluating long-term value creation and innovation

  ## Output Format
  Generate markdown reports with clear sections, metrics, and actionable insights that help both developers and managers understand performance in business context, not just technical metrics.
Strategy #2 – Weekly/Monthly KPI PR Analysis
One of the most important parts of being a leader is setting clear, quantifiable success metrics that aligns you and your team.
If your team doesn’t have a clear goal, and clear KPIs they’re following, it’ll slow down your business’s execution. You’ll have different team members rowing in different directions because they interpret broad terms like “grow the business”, “get more customers”, or “come up with ideas” differently.
Every year, I set a clear goal for our team. This year, the goal is Gross Sales.
Once you have the goal identified, it’s about team-based KPIs that impact the goal. Some of our team-based KPIs this year are First Reply Time <6 hours (Support) and % of On-Time Releases From Our Monthly Product Plan >80% (Product).
But KPIs aren’t just useful for measuring team alignment and focus. We also identify KPIs for our products that give us signals on weak and strong features or areas to fix or scale.
When we go deeper into Product, each of our products have KPIs that relate to top of funnel (ToFU), middle of funnel (MoFU), and bottom of funnel (BoFU).
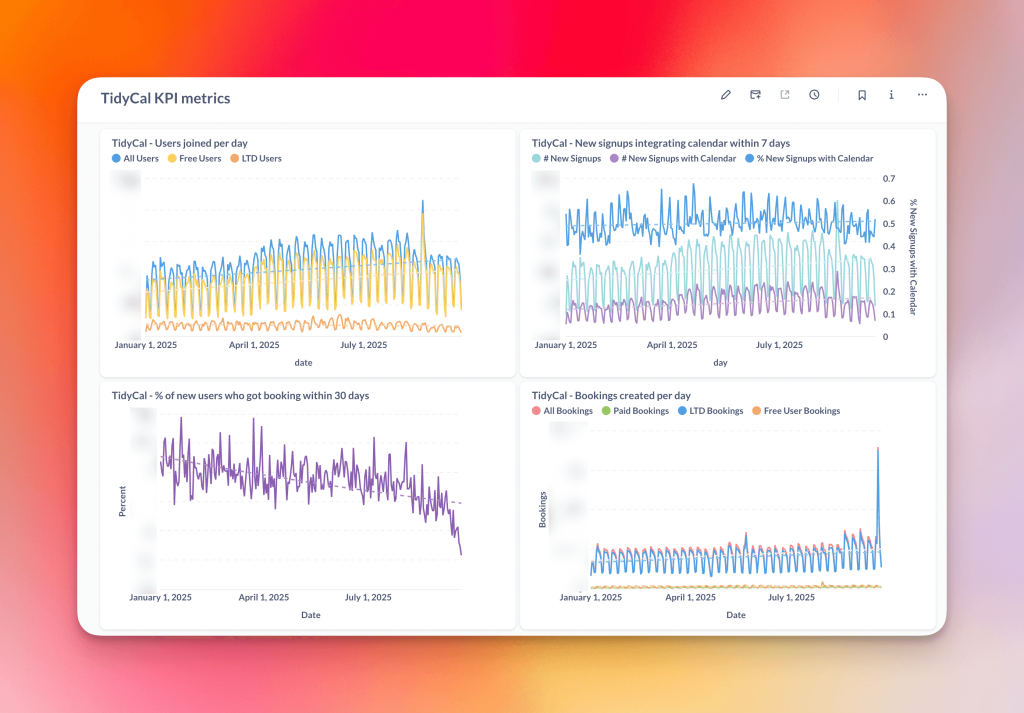
For TidyCal — one of our $1M+ products — the KPIs are:
- ToFU – Lever #1: # new signups per day
- MoFU – Lever #2: % new signups integrating calendar within 7 days
- MoFU – Lever #3: % new signups getting booking within 30 days
- MoFU – Lever #4: # total bookings per day
- BoFU – Lever #5: % CVR Free-to-LTD
I have a dashboard (using Metabase) that I check weekly to see how the KPIs are performing.
The point of these KPIs is to do a few things:
- Stay ahead of any issues. Recently, as seen in the screenshot, we TidyCal signups drop by ~20%. We used the data to diagnose an issue with underperforming ads, and then work towards correction. We also saw a big uptick in bookings per day from a spam user, which can also been seen in the screenshot, so we were able to quickly catch them, ban them, and implement updates to our spam mitigation systems.
- Tell me which KPIs are weak points to improve. With TidyCal, we can also see the speed at which users get a booking was going down. When I see a KPI is weak, I can prioritize updates and fixes accordingly.
- Understand which products are taking off. In a separate Dashboard for BreezeDoc, I see it’s been growing explosively this year in all KPIs. This tells me that it’s worth the continued efforts to keep improving and growing the product. Doubling down on what works.
Using Claude Code, I can combine the KPIs with more contextual understanding of our developer actions via GitHub pull requests (PRs).
The weekly report helps me understand if features really hurt or helped our KPIs, so I can iterate accordingly. Launch quickly, see the data for what’s working well, do more of what works, stop doing what doesn’t.
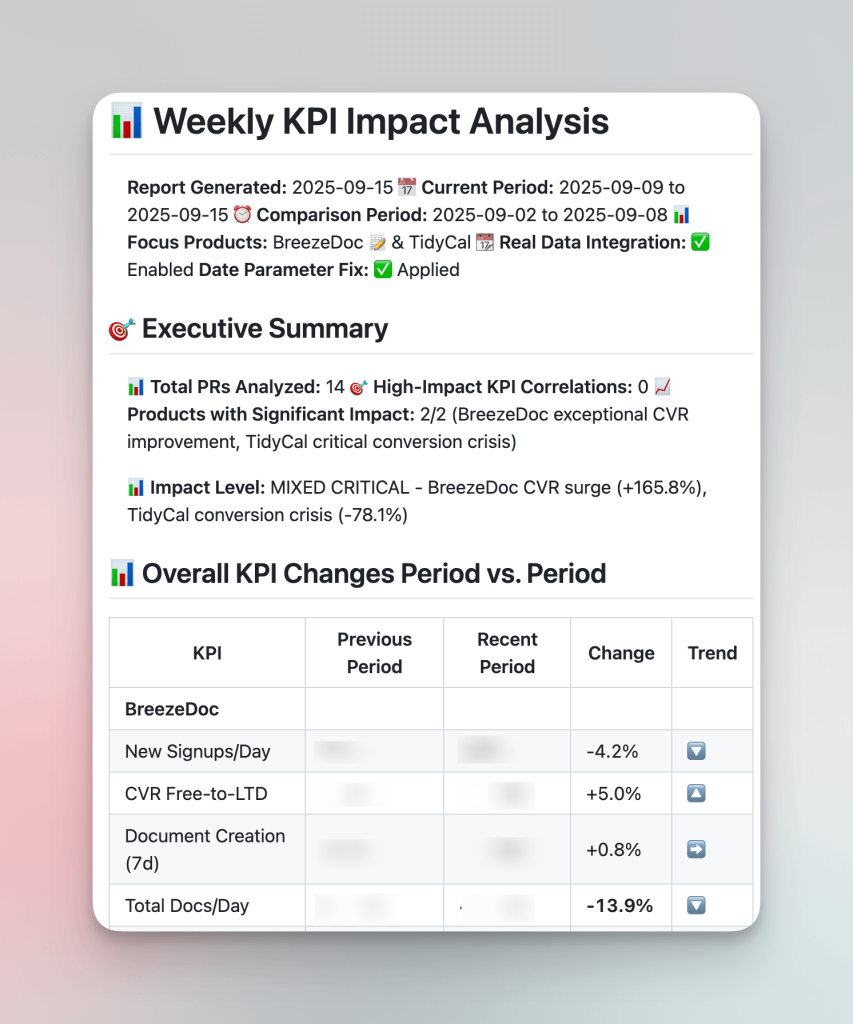
To enhance accuracy, I use Zen MCP tools to connect with Claude Code. It offers more accurate analysis and cross-model consensus to give better data accuracy. Specifically, I have it integrated with the OpenAI and Gemini APIs.
Here’s a prompt you can use in Claude Code to start creating your own weekly KPI GitHub pull request analysis:
  # Weekly KPI PR Analysis Prompt

  Create a comprehensive system that correlates developer pull requests with real business KPIs to measure actual impact on key metrics. The system should:

  ## Core Requirements

  ### 1. Business KPI Integration
  - Connect to your analytics platform (Metabase, Mixpanel, etc.) via API
  - Define 5-10 specific KPIs that matter to your business (signups, conversions, engagement, etc.)
  - Implement period-over-period comparison (current week vs previous week)
  - Use REAL data only - never mock or simulate metrics

  ### 2. GitHub PR Analysis
  - Fetch PRs from specified repositories for weekly analysis periods
  - Analyze PR content, titles, descriptions, and code changes
  - Categorize PRs by business impact area (onboarding, conversion, core features, etc.)
  - Track developers and their contribution patterns

  ### 3. KPI Correlation Engine
  Create intelligent correlation between PRs and KPIs:
  - **Feature Area Mapping**: Map PR changes to specific KPI impact areas
  - **Confidence Scoring**: Use AI to assess likelihood of PR impacting specific KPIs (0.1-1.0 scale)
  - **Business Impact Classification**: High/Medium/Low impact based on KPI relevance
  - **Historical Validation**: Track prediction accuracy over time

  ### 4. Enhanced AI Analysis
  Use AI tools to:
  - Analyze code complexity and architectural impact
  - Assess user experience and onboarding improvements
  - Generate strategic insights and recommendations
  - Validate correlations with multi-model consensus

  ### 5. Automated Weekly Reports
  Generate comprehensive reports with:
  - Executive summary with total impact
  - KPI-specific correlation analysis with confidence levels
  - Direct links to your analytics dashboards
  - Strategic recommendations for next week
  - Visual formatting with clear action items

  ## Key Innovation: Business-First Analysis
  Unlike code-focused metrics, prioritize:
  - **Customer Impact**: Focus on features that affect user experience
  - **Revenue Correlation**: Emphasize conversion and monetization features
  - **Onboarding Optimization**: Special weight for user activation metrics
  - **Competitive Advantage**: Identify breakthrough features vs maintenance

  ## Business Model Adaptation
  Customize KPI weightings for your business model:
  - **SaaS**: MRR growth, churn reduction, feature adoption
  - **E-commerce**: Conversion rate, cart abandonment, repeat purchases
  - **B2B**: Lead qualification, sales cycle acceleration, customer success
  - **Marketplace**: User acquisition, transaction volume, seller/buyer engagement

  ## Implementation Framework
  1. **KPI Definition**: Map your top business metrics to specific dashboard URLs
  2. **PR Categorization**: Create business impact categories relevant to your product
  3. **Correlation Rules**: Define how code changes map to business outcomes
  4. **Automation Setup**: Schedule weekly analysis aligned with your reporting cycle
  5. **Validation Loop**: Track prediction accuracy and calibrate correlation weights

  ## Output Format
  Generate actionable weekly reports that help both developers and product managers understand how code changes drive business results, creating alignment between engineering work and company objectives.
Strategy #3 – Weekly Product Insights Analysis
Every week, we get hundreds of support messages in our support inbox (HelpScout).
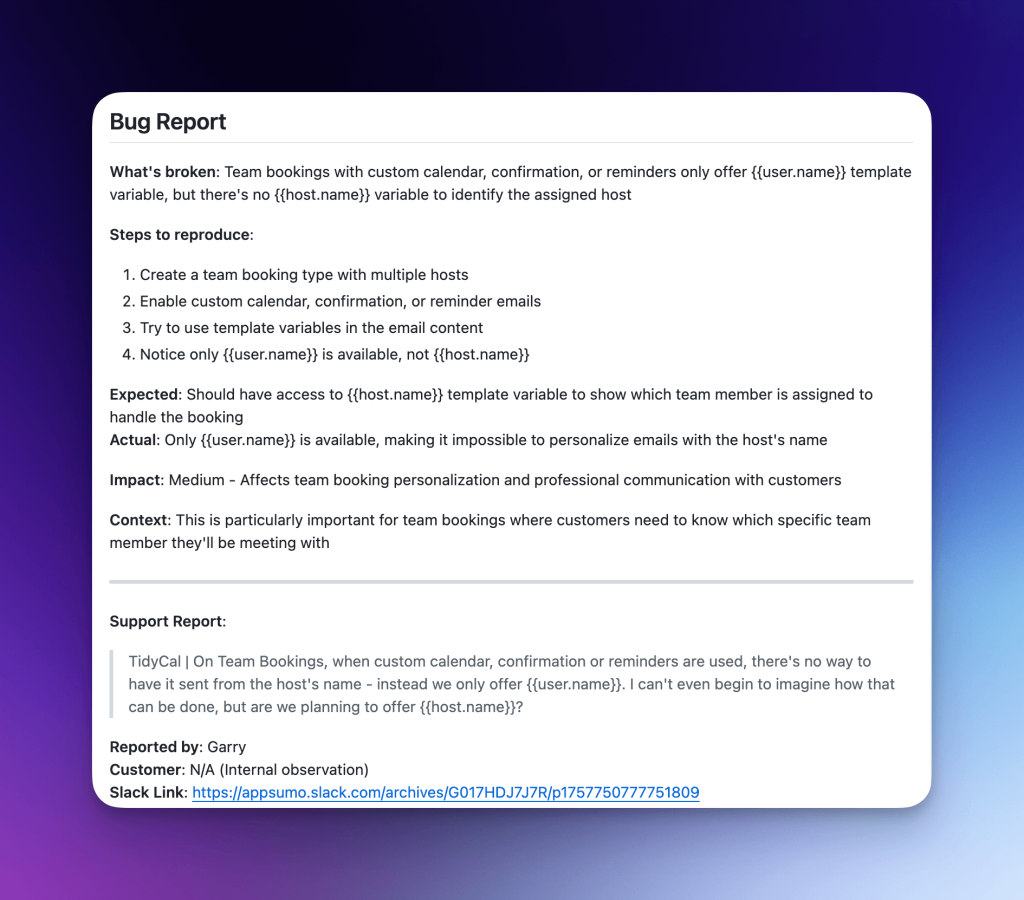
We have a process in place to triage the most important bugs, including a Claude Code prompt that our developers can quickly run to get the issue and context into GitHub. Here’s an example of a bug report that was created into GitHub Issue that was created using Claude Code:
But with hundreds of bug reports per week, it can be hard to prioritize which ones really matter. Because some customer voices can be loud and threatening, it’s hard for a Support team member to ignore it knowing that it’s not very important in the grand scheme of 5M+ people interacting with our products every month.
To give more high-level customer understanding, I use Claude Code to automate a weekly Product Insights report.
This report pulls from the entire HelpScout support system for the pervious week to give me larger trends and observations about customer tickets.
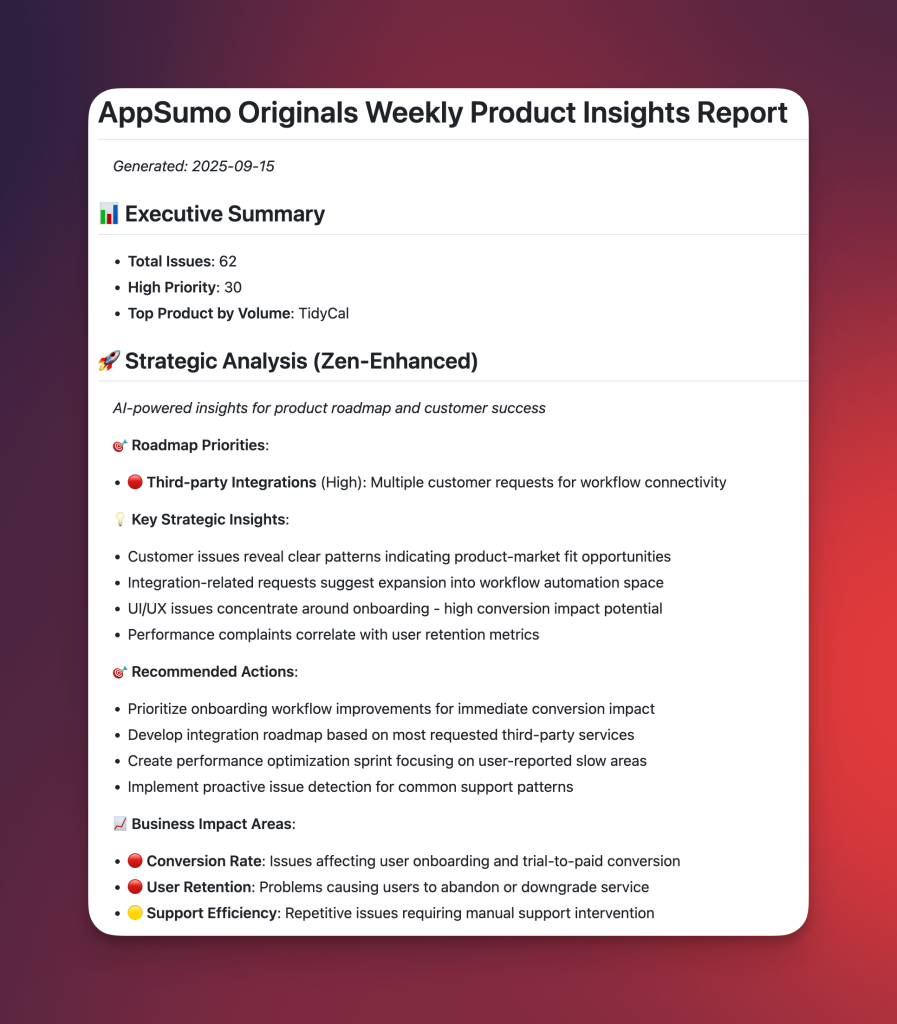
Using this report, I can get a 30,000 foot view on what’s been wrong with our products. This helps balance the micro-view that our team has with a larger macro view, and gives me insights into which updates, bug fixes, improvements, and tweaks to make to prioritize for our products.
Here’s a prompt you can use in Claude Code for your own weekly product insights analyzer report:
  # Customer Support Product Insights Analyzer Prompt

  Create an automated weekly system that analyzes customer support conversations to generate actionable product insights. The system should transform support data into strategic intelligence for product development.

  ## Core Requirements

  ### 1. Support Platform Integration
  - Connect to your support platform API (HelpScout, Zendesk, Intercom, etc.)
  - Authenticate and fetch conversation data for specified time periods
  - Handle pagination and rate limiting for large datasets
  - Filter out internal team responses and auto-replies

  ### 2. Intelligent Content Analysis
  - **Full Conversation Processing**: Read entire conversation threads, not just subject lines
  - **Customer-Only Focus**: Automatically exclude internal responses, auto-responders, and team discussions
  - **Context Understanding**: Analyze actual customer problems vs generic ticket titles
  - **Multi-Product Support**: Handle multiple products/services in one support system

  ### 3. Advanced Issue Classification
  Create 8+ categories with smart keyword detection:
  - **Bugs**: Errors, broken features, malfunctions
  - **Feature Requests**: Enhancement suggestions, missing functionality
  - **Integrations**: Third-party connections, API issues, sync problems
  - **UI/UX**: Usability issues, confusing workflows, design problems
  - **Performance**: Speed issues, timeouts, optimization needs
  - **Account Issues**: Login, billing, subscription problems
  - **Data Problems**: Missing data, corruption, import/export issues
  - **Mobile Issues**: App-specific problems, responsive design

  ### 4. Pattern Recognition & Insights
  - **Similar Issue Clustering**: Group identical or related problems
  - **Priority Scoring**: Assign High/Medium/Low priority based on impact keywords
  - **Volume Tracking**: Count issues by product and category
  - **Trend Analysis**: Compare current week to historical baselines
  - **Actionable Recommendations**: Generate specific next steps for product teams

  ### 5. Automated Weekly Reports
  Generate comprehensive markdown reports with:
  - Executive summary with key metrics
  - Product-specific breakdown of issues
  - High-priority problems requiring immediate attention
  - Feature request analysis and frequency
  - Similar issue patterns and their frequency
  - Strategic recommendations for product roadmap

  ## Key Innovation: Customer Voice to Product Strategy

  Unlike basic support metrics, focus on:
  - **Product Intelligence**: What features are customers actually struggling with?
  - **Competitive Gaps**: What functionality do customers expect but don't find?
  - **Onboarding Friction**: Where do new users get stuck in their journey?
  - **Power User Needs**: What advanced features would increase retention?
  - **Quality Indicators**: Which bugs impact the most customers?

  ## Business Impact Analysis
  Correlate support insights with business metrics:
  - **Churn Risk**: Issues that commonly precede cancellations
  - **Expansion Opportunities**: Feature requests from high-value customers
  - **Onboarding Optimization**: Common new user pain points
  - **Competitive Intelligence**: Comparisons customers make to competitors

  ## Automation Framework
  1. **Data Collection**: Scheduled API calls to support platform
  2. **Content Processing**: AI-powered conversation analysis and categorization
  3. **Pattern Detection**: Statistical analysis of issue clustering and trends
  4. **Report Generation**: Automated markdown reports with actionable insights
  5. **Distribution**: Save reports and optionally notify product teams

  ## Sample Output Structure
  ```markdown
  # Weekly Product Insights Report
  **Period:** [Date Range]
  **Total Conversations Analyzed:** [Number]

  ## Executive Summary
  - High Priority Issues: [Count]
  - Most Reported Bug: [Description]
  - Top Feature Request: [Description]
  - Product Requiring Attention: [Product Name]

  ## [Product Name] Analysis
  **Total Issues:** [Count] | **High Priority:** [Count]

  ### Critical Bugs (Immediate Action Required)
  1. [Bug description] - [Frequency] reports
  2. [Bug description] - [Frequency] reports

  ### Feature Requests (Roadmap Input)
  1. [Feature description] - [Frequency] requests
  2. [Feature description] - [Frequency] requests

  ### Similar Issue Patterns
  - [Pattern description]: [Count] identical reports

  ## Strategic Recommendations
  1. **Immediate Actions:** [Specific bugs to fix]
  2. **Feature Prioritization:** [Most requested features]
  3. **Documentation Gaps:** [Common confusion points]
  4. **Process Improvements:** [Support workflow optimizations]
—
There’s so much you can do with Claude Code outside of coding, and I hope these ideas are just the start for you with your Claude Code adventure.
To keep going down the path of learning more about Claude Code, here are more great resources:
- How Anthropic teams use Claude Code (including marketing, design, legal, and more)
- ccstatusline to add more context to your Claude Code window
- r/ClaudeAI subreddit to read more about how people are using Claude Code
- A list on reddit of essential resources for Claude Code
- Claude Code templates: Ready-to-use configs for Claude Code projects